Case study
Context-Adjusted Driver Performance Reporting
A fairer way to measure operational performance.
DisclosureThe portfolio version uses fully synthetic employee, route, payroll and performance data to protect confidential information.
A fairer way to measure performance
Raw productivity metrics can be misleading when employees perform different types of work.
This project created a performance-reporting model that combines route activity, payroll data and historical results to compare drivers against similar work rather than a single fleet-wide average.
The model architecture
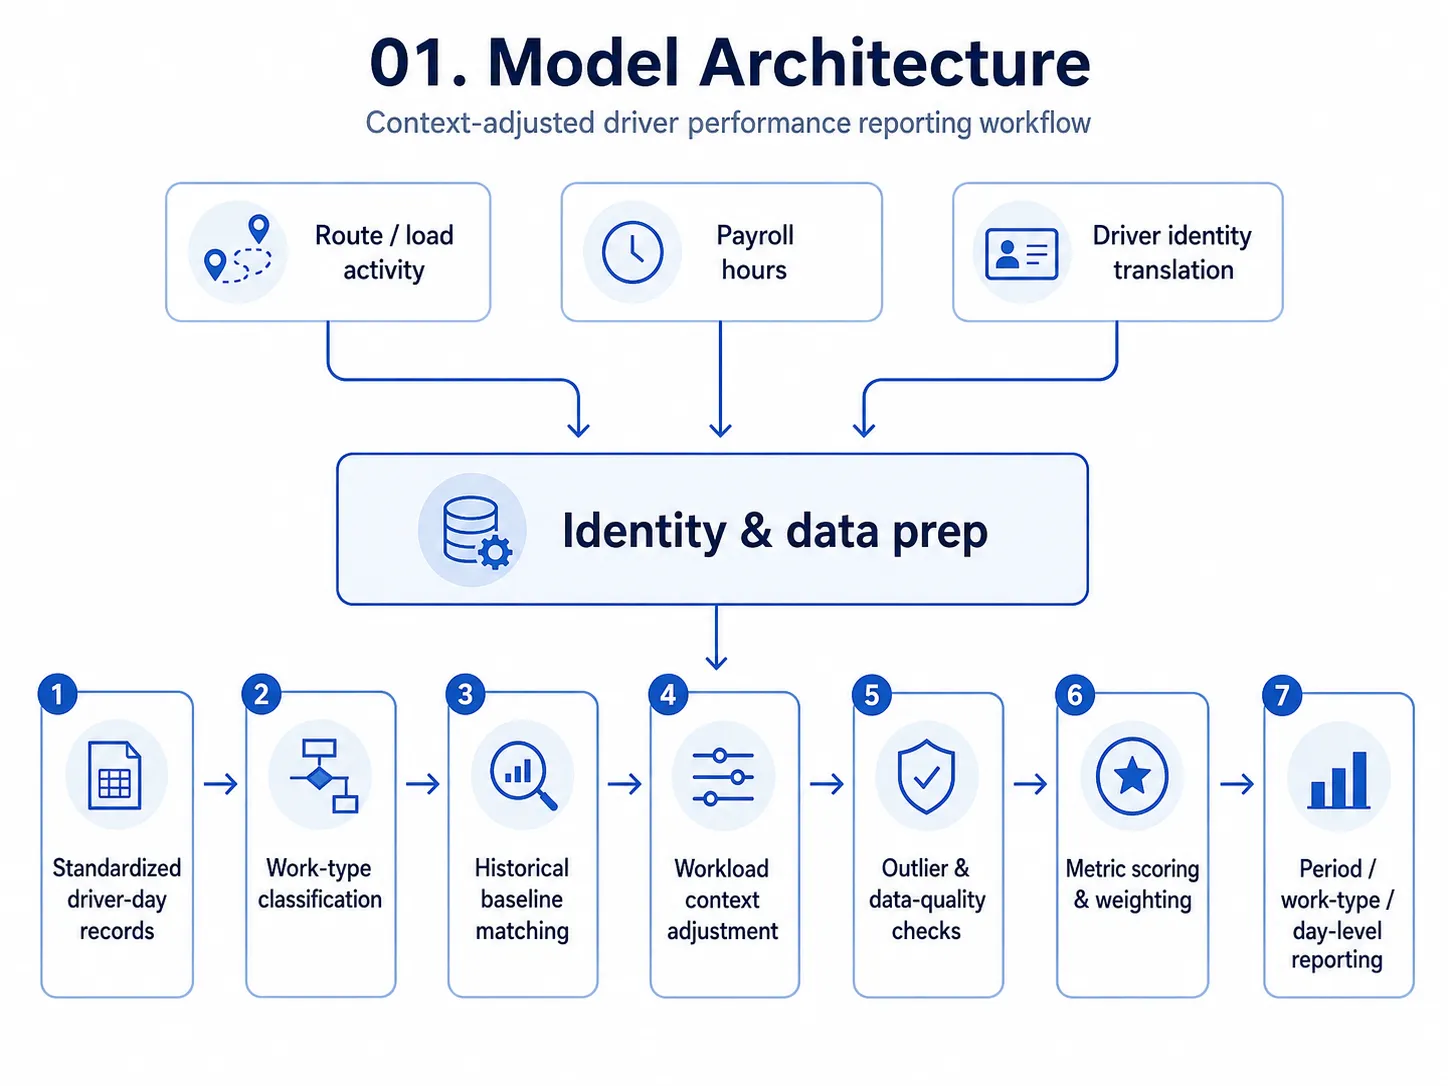
The model brings together route or load activity, payroll hours and driver identity translation before creating standardized driver-day records.
It then classifies work, matches historical baselines, adjusts for workload context, checks outliers and data quality, and produces period-, work-type- and day-level reporting.
How a comparable score is built
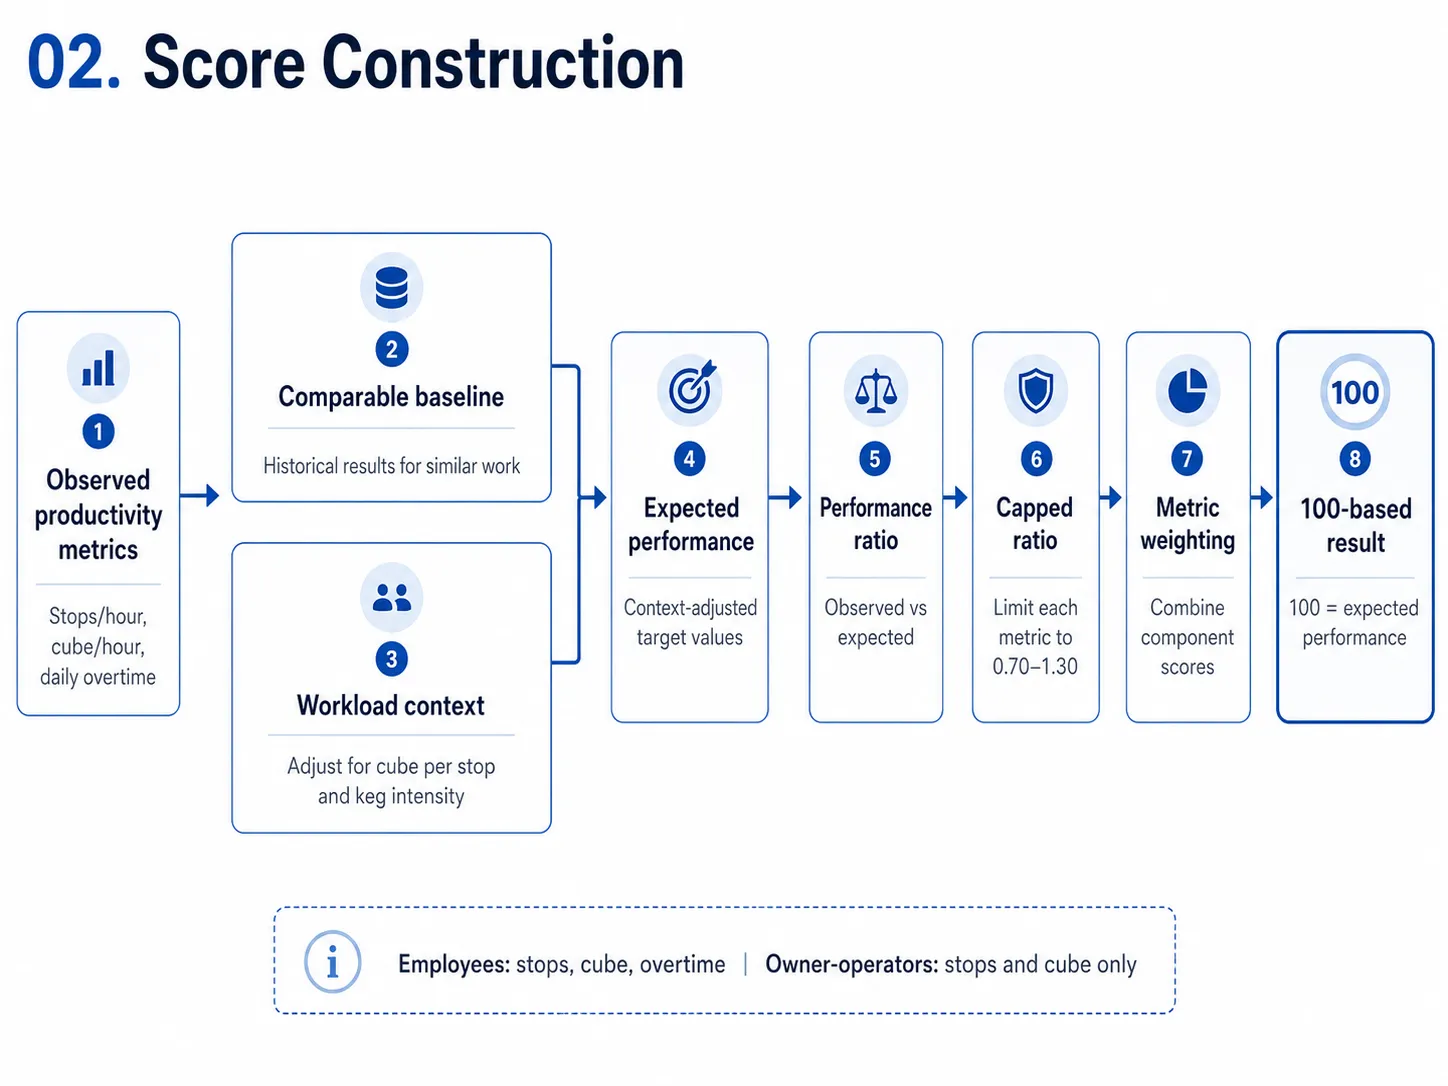
Historical results establish an expected baseline for each group, while workload characteristics — including delivery size and physical handling requirements — adjust expectations further.
The model reconciles employee records across different systems, separates daily overtime from payroll-driven weekly overtime, handles employees and owner-operators differently where appropriate, and flags abnormal or incomplete records so they do not distort results.
A view for team-level reporting
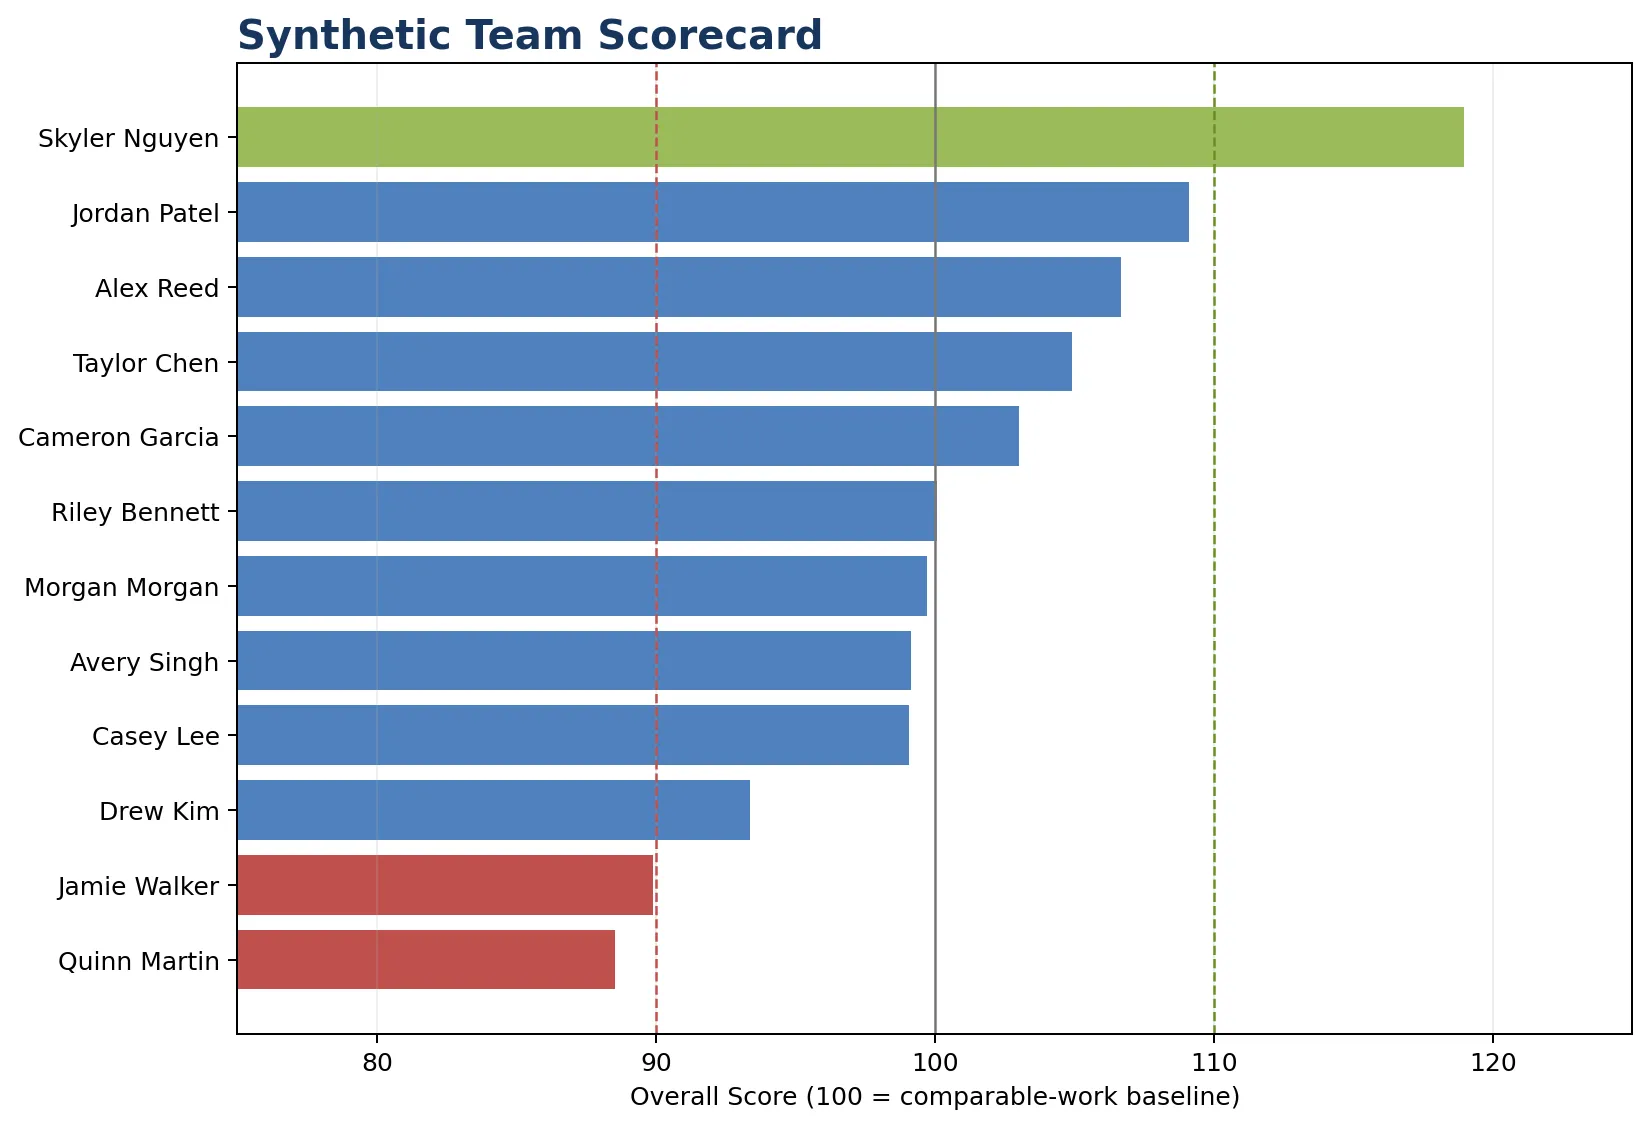
Each driver receives a normalized score centred on 100, representing expected performance for comparable work.
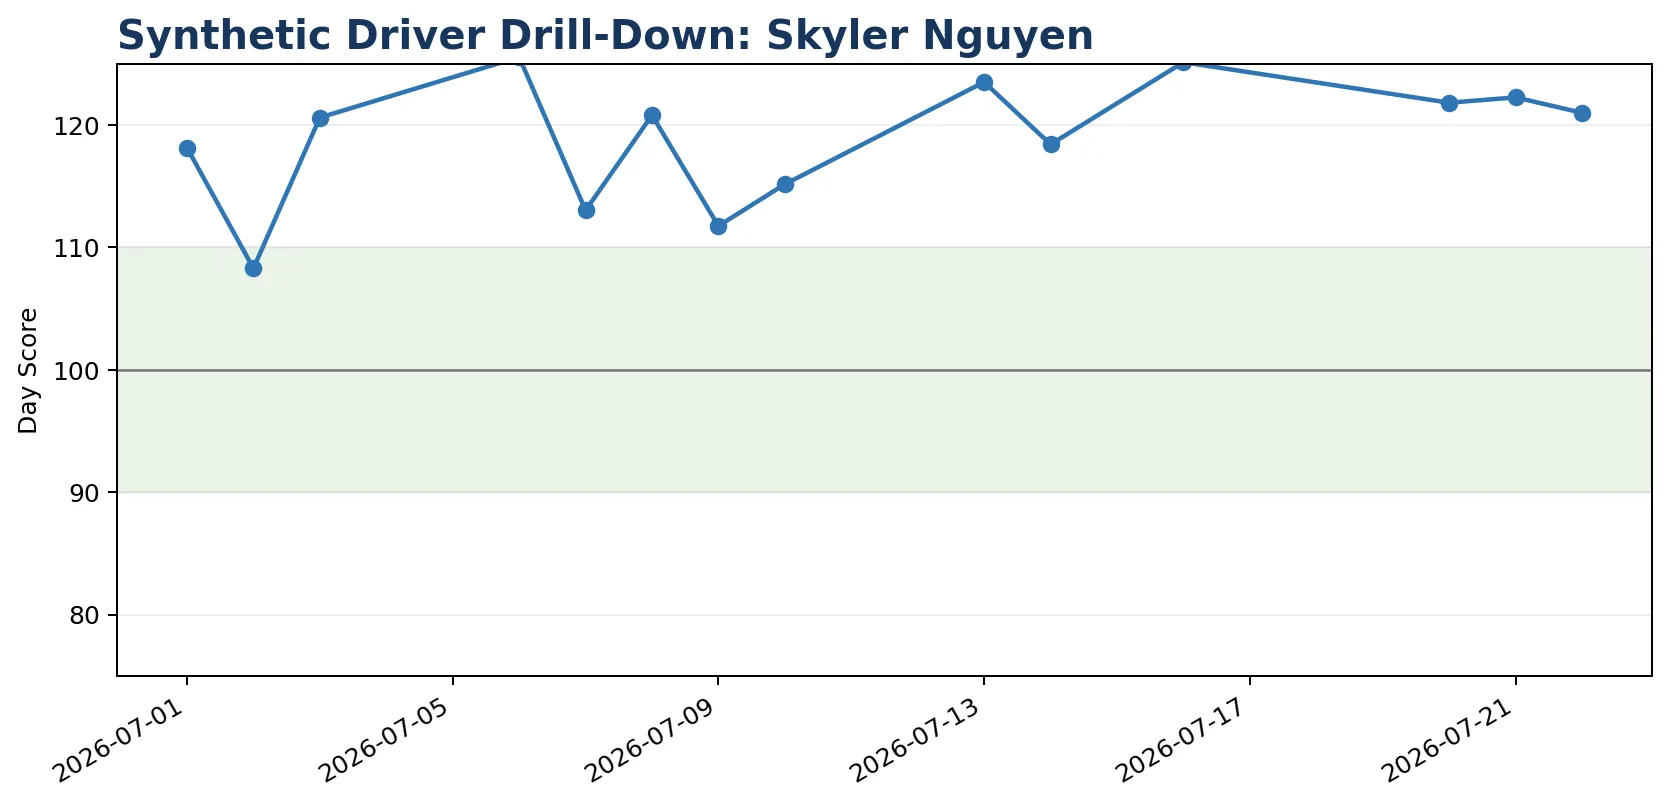
Supervisors can move from a high-level team scorecard into work-type and individual-day detail to understand exactly what contributed to a result.
Trace a result into its operating context
Supervisors can move from a high-level team scorecard into work-type and individual-day detail to understand exactly what contributed to a result.
The model is designed to distinguish strong performance, normal variation and results that warrant further review.
A more defensible framework
The result is a more transparent and defensible framework for identifying strong performance, normal variation and results that warrant further review.